One-Way Analysis of Variance
This is some really beautiful stuff here! It ties together many aspects of what we've been doing all semester.
A One-Way Analysis of Variance is a way to test the equality of three or more means at one time by using variances.
Assumptions
- The populations from which the samples were obtained must be normally or approximately normally distributed.
- The samples must be independent.
- The variances of the populations must be equal.
Hypotheses
The null hypothesis will be that all population means are equal, the alternative hypothesis is that at least one mean is different.The null hypothesis can be written as
Do you remember the little song from Sesame Street?
One of these things is not like the others; One of these things just doesn't belong; Can you tell which thing is not like the others, By the time I finish my song?There was another version that went something like this.
Three of these things belong together; Three of these things are kind of the same; Can you guess which one of these doesn't belong here? Now it's time to play our game (time to play our game).Now actually, the words I remember are a little bit different from that, but it's been many, many moons since I've watched the show, so I'll just take the words as what someone else says they are.
Anyway, the point is that only one of the things had to be different for them to not all be the same. This is exactly the way the alternative hypothesis works. The null hypothesis says that they're all equal to each other and the alternative says that at least one of them is different.
In the following, lower case letters apply to the individual samples and capital letters apply to the entire set collectively. That is, n is one of many sample sizes, but N is the total sample size.
Example
Test the claim that the exam scores on the eight College Algebra exams are equal.Below are the test scores from one of my algebra classes. The scores for each exam have been ranked numerically, just so no one tries to figure out who got what score by finding a list of students and comparing alphabetically.
Now, there are some problems here. The conditions necessary to perform a one-way ANOVA haven't been verified. In other words, I haven't verified that the populations were normally distributed or that the population variances are equal, but we're going to ignore those for purposes of the example. Realize however, that the results may not be accurate when the assumptions aren't met.
| Exam | 1 | 2 | 3 | 4 | 5 | 6 | 7 | 8 |
| Scores | 21 35 40 42 45 57 59 60 60 61 62 64 65 67 68 68 72 73 74 75 76 78 80 91 | 17 45 49 57 57 61 62 62 63 64 67 69 74 75 78 78 78 79 80 86 88 89 90 | 24 52 56 59 59 63 65 67 68 72 73 74 75 75 76 80 82 82 83 88 90 90 | 37 43 52 54 58 60 61 62 63 64 67 67 71 72 74 75 77 77 79 | 37 37 60 65 69 75 75 76 76 83 84 85 87 87 89 89 90 | 21 43 50 51 53 69 69 70 72 73 74 74 80 81 89 94 | 29 31 43 55 62 63 64 66 69 71 75 75 77 83 86 91 | 23 38 43 52 53 56 57 62 63 64 65 70 72 73 75 76 80 80 83 |
| n | 24 | 23 | 22 | 19 | 17 | 16 | 16 | 19 |
| mean | 62.21 | 68.17 | 70.59 | 63.84 | 74.35 | 66.44 | 65.00 | 62.37 |
| variance | 255.91 | 281.60 | 226.35 | 133.03 | 274.62 | 345.46 | 325.87 | 247.25 |
Are all of the data values within any one group the same? No! So there is some within group variation. The within group is sometimes called the error group.
Are all the sample means between the groups the same? No! So there is some between group variation. The between group is sometimes called the treatment group.
There are two sources of variation here. The between group and the within group.
This gives us the basic layout for the ANOVA table.
| Source | SS | df | MS | F |
| Between | ||||
| Within | ||||
| Total |
SS stands for Sum of Squares. It is the sum of the squares of the deviations from the means. Back when we introduced variance, we called that a variation. In other words, each number in the SS column is a variation.
df stands for degrees of freedom. We'll talk more about that in a moment.
MS stands for Mean Square. It is a kind of "average variation" and is found by dividing the variation by the degrees of freedom. Well, thinking back to the section on variance, you may recall that a variance was the variation divided by the degrees of freedom. So, each number in the MS column is found by dividing the number in the SS column by the number in the df column and the result is a variance.
F stands for an F variable. F was the ratio of two independent chi-squared variables divided by their respective degrees of freedom. If you remember, that simplified to be the ratio of two sample variances. This is beautiful, because we just found out that what we have in the MS column are sample variances. So the F column will be found by dividing the two numbers in the MS column.
Filling in the table
Sum of Square = VariationsThere's two ways to find the total variation. You can add up the two sources of variation, the between group and the within group. The other way is to lump all the numbers together into one big pot.
If you lump all the numbers together, you find that there are N = 156 numbers, with a mean of 66.53 and a variance of 261.68. Since the variance is the variation divided by the degrees of freedom, then the variation must be the degrees of freedom times the variance. Since the degrees of freedom would be N-1 = 156-1 = 155, and the variance is 261.68, then the total variation would be 155 * 261.68 = 40560.40 (if I hadn't rounded the intermediate steps, I would have got 40560.84)
Ok, the other variations are much harder to find. In fact, the total variation wasn't all that easy to find because I would have had to group all the numbers together. That's pretty easy on a spreadsheet, but with the calculator, it would have meant entering all the numbers once for each list and then again to find the total. Besides that, since there are 156 numbers, and a list can only hold 99 numbers, we would have problems. Below, in the more general explanation, I will go into greater depth about how to find the numbers. Basically, unless you have reason to do it by hand, use a calculator or computer to find them for you.
df = Degrees of Freedom
Now, for the next easy part of the table, the degrees of freedom. We already know the total degrees of freedom, N-1 = 155.
How many groups were there in this problem? Eight - one for each exam. So when we are comparing between the groups, there are 7 degrees of freedom. In general, that is one less than the number of groups, since k represents the number of groups, that would be k-1.
How many degrees of freedom were there within the groups. Well, if there are 155 degrees of freedom altogether, and 7 of them were between the groups, then 155-7 = 148 of them are within the groups. Isn't math great? In general terms, that would be (N-1) - (k-1) = N-1-k+1=N-k.
Oooh, but the excitement doesn't stop there. One of our assumptions was that the population variances were equal. Think back to hypothesis testing where we were testing two independent means with small sample sizes. There were two cases. Case 1 was where the population variances were unknown but unequal. In that case, the degrees of freedom was the smaller of the two degrees of freedom. Case 2 was where the population variances were unknown, but assumed equal. This is the case we have here. The degrees of freedom in that case were found by adding the degrees of freedom together. That's exactly what we'll do here.
Since the first group had n=24, there would be df=23. Similarly, the second group had n=23, so df=22. If you add all the degrees of freedom together, you get 23 + 22 + 21 + 18 + 16 + 15 + 15 + 18. Guess what that equals? You got it ... 148. Isn't this great?
| Source | SS | df | MS | F |
| Between | 2417.49 | 7 | ||
| Within | 38143.35 | 148 | ||
| Total | 40564.84 | 155 |
The variances are found by dividing the variations by the degrees of freedom, so divide the SS(between) = 2417.49 by the df(between) = 7 to get the MS (between) = 345.356 and divide the SS(within) = 38143.35 by the df(within) = 148 to get the MS(within) = 257.725.
There is no total variance. Well, there is, but no one cares what it is, and it isn't put into the table.
F
Once you have the variances, you divide them to find the F test statistic. Back in the chapter where the F distribution was first introduced, we decided that we could always make it into a right tail test by putting the larger variance on top.
In this case, we will always take the between variance divided by the within variance and it will be a right tail test.
So, divide MS(between) = 345.356 by MS(within) = 257.725 to get F = 1.3400
| Source | SS | df | MS | F |
| Between | 2417.49 | 7 | 345.356 | 1.3400 |
| Within | 38143.35 | 148 | 257.725 | |
| Total | 40564.84 | 155 |
Finishing the Test
Well, we have all these wonderful numbers in a table, but what do we do with them?
We have a F test statistic and we know that it is a right tail test. We need a critical value to compare the test statistic to. The question is, which critical F value should we use?
Are you ready for some more really beautiful stuff?
What two number were divided to find the F test statistic? The variance for the between group and the variance for the within group. Notice that the between group is on top and the within group is on bottom, and that's the way we divided. Also notice that there were 7 df on top and 148 df on bottom. There we go. We look up a critical F value with 7 numerator df and 148 denominator df.
Since no level of significance was given, we'll use alpha = 0.05. We have two choices for the denominator df; either 120 or infinity. The critical F value for F(7,120) = 2.0868 and the critical F value for F(7,infinity) = 2.0096. The critical F value with 120 df is larger and therefore less likely to reject the null hypothesis in error, so it's the one we should use. Actually, in this case, it won't matter as both critical F values are larger than the test statistic of F = 1.3400, and so we will fail to reject the null hypothesis with either one.
So, what did we find out? There is insufficient evidence at the 0.05 level of significance to reject the claim that the means are equal. In "lay speak", we can't show at least one mean is different.
What does that mean? Well, it means that the class was very consistent throughout the semester.
Which means are different?
Well, in this example, we weren't able to show that any of them were. So, we shouldn't go trying to find out which ones are different, because they're all the same (lay speak).
Okay, now for a less concrete example.
Grand Mean
 The grand mean doesn't care which sample the data originally came from, it dumps all the data into one pot and then finds the mean of those values.
The grand mean of a set of samples is the total of all the data values divided by the total sample size. This requires that you have all of the sample data available to you, which is usually the case, but not always. It turns out that all that is necessary to find perform a one-way analysis of variance are the number of samples, the sample means, the sample variances, and the sample sizes.
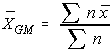 Another way to find the grand mean is to find the weighted average of the sample means. The weight applied is the sample size.
Total Variation
The total variation (not variance) is comprised the sum of the squares of the differences of each mean with the grand mean.
There is the between group variation and the within group variation. The whole idea behind the analysis of variance is to compare the ratio of between group variance to within group variance. If the variance caused by the interaction between the samples is much larger when compared to the variance that appears within each group, then it is because the means aren't the same.
Between Group Variation (Treatment)
The variation due to the interaction between the samples is denoted SS(B) for Sum of Squares Between groups. If the sample means are close to each other (and therefore the Grand Mean) this will be small. There are k samples involved with one data value for each sample (the sample mean), so there are k-1 degrees of freedom.
The variance due to the interaction between the samples is denoted MS(B) for Mean Square Between groups. This is the between group variation divided by its degrees of freedom. It is also denoted by
The between group classification is variation is sometimes called the treatment because it is the characteristic we're interested in. The idea for the name comes from experiments where you have a control group that doesn't receive the treatment, and an experimental group where that group does receive the treatement.
Within Group Variation (Error)
The variation due to differences within individual samples, denoted SS(W) for Sum of Squares Within groups. Each sample is considered independently, no interaction between samples is involved. The degrees of freedom is equal to the sum of the individual degrees of freedom for each sample. Since each sample has degrees of freedom equal to one less than their sample sizes, and there are k samples, the total degrees of freedom is k less than the total sample size: df = N - k.
The variance due to the differences within individual samples is denoted MS(W) for Mean Square Within groups. This is the within group variation divided by its degrees of freedom. It is also denoted by
The within group classification is sometimes called the error. Remember that error means deviation, not that something was done wrong.
F test statistic
 Recall that a F variable is the ratio of two independent chi-square variables divided by their respective degrees of freedom. Also recall that the F test statistic is the ratio of two sample variances, well, it turns out that's exactly what we have here. The F test statistic is found by dividing the between group variance by the within group variance. The degrees of freedom for the numerator are the degrees of freedom for the between group (k-1) and the degrees of freedom for the denominator are the degrees of freedom for the within group (N-k).
Summary Table
All of this sounds like a lot to remember, and it is. However, there is a table which makes things really nice.| SS | df | MS | F | |
| Between | SS(B) | k-1 | SS(B) ----------- k-1 | MS(B) -------------- MS(W) |
| Within | SS(W) | N-k | SS(W) ----------- N-k | . |
| Total | SS(W) + SS(B) | N-1 | . | . |
Decision Rule
The decision will be to reject the null hypothesis if the test statistic from the table is greater than the F critical value with k-1 numerator and N-k denominator degrees of freedom.If the decision is to reject the null, then at least one of the means is different. However, the ANOVA does not tell you where the difference lies. For this, you need another test, either the Scheffe' or Tukey test.


No comments:
Post a Comment